There is a map for everything. Even in identifying hazards and attendant vulnerabilities in communities.
During Midyear Term 2023, the UP Department of Geography conducts an extension program through its Geography 192 course (Field Methods in Geography). The program was instituted in the 1990s and involves faculty and undergraduate students providing technical assistance and utilizing geographic information resources and tools for community-based research and development planning. It has earned recognition such as the Best Extension Program of Degree Granting Units award in the Parangal para sa Programang Pang-Ekstensyon in 2016 and the Gawad Pangulo Award for Excellence in Public Service in 2017.
Since its inception, the UP Department of Geography has conducted more than 70 field classes. The fieldwork in 2023 was in the Municipality of Libmanan, Camarines Sur, where the department assisted the local government unit (LGU) in updating its Ecological Profile. Twenty students, under supervision of two faculty members, collaborated with the Technical Working Group of LGU Libmanan and village officials to gather geographic data and generate maps using Geographic Information System (GIS). One section of the Ecological Profile is about the municipality’s susceptibility to various natural hazards.
Mapping exposure to hazards
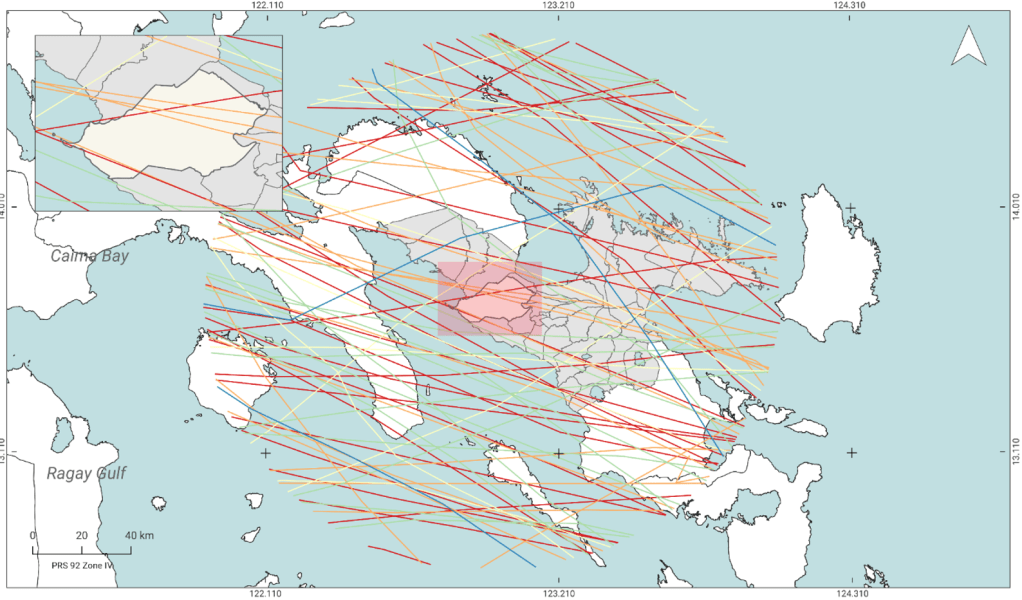
The Philippines’ geographical position in the western part of the Pacific Ocean exposes the country to tropical cyclones. Cagayan Valley, Eastern Visayas, Surigao provinces, and the Bicol region, including the municipality of Libmanan, are among the areas frequently affected. Map 1 shows lines indicating the typhoon tracks within the 100-kilometer radius of municipality. Typhoon tracks show the trajectory of the tropical cyclone based on the location of its center, or the “eye”. According to a report from the local Municipal Disaster Risk Reduction Office (MDRRMO), tropical cyclones are the most likely and significant hazard for most barangays. In 2020, typhoons affected 86,190 individuals, representing approximately 76% of the total population for that year (MDRRMO, 2023).
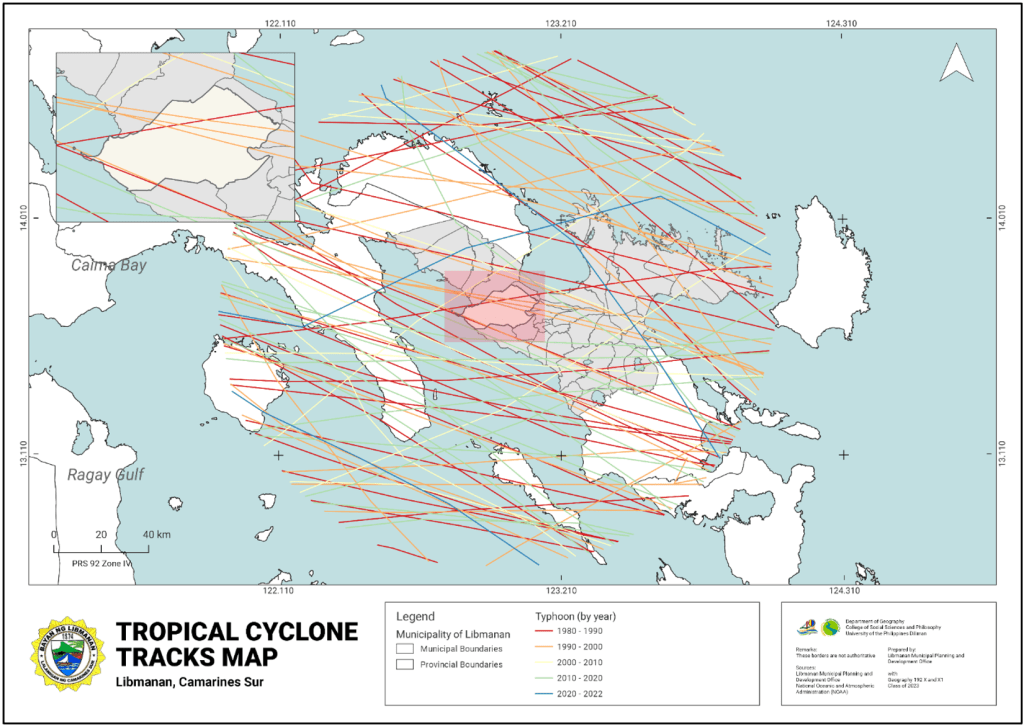
Map 1 – Tropical cyclone tracks within the 100-kilometre radius of Libmanan, Camarines Sur from 1980 to 2022, Libmanan Municipal Planning and Development Office with Geography 192 X1, Class 2023
During heavy rainfall or tropical cyclones, hydrometeorological hazards such as rain-induced flooding, rain-induced landslides, and storm surges pose threats to numerous barangays from highlands to coastal areas, or from ridge-to-reef (refer to Map 2). Darker shades on the map denote a higher intensity of a specific hazard. A deeper red signifies the potential occurrence of a 1.5- to 5-meter-high storm surge. Hydrometeorological hazards may occur simultaneously and impact communities in low-lying, steep areas, as well as those situated near the coast during a tropical cyclone.
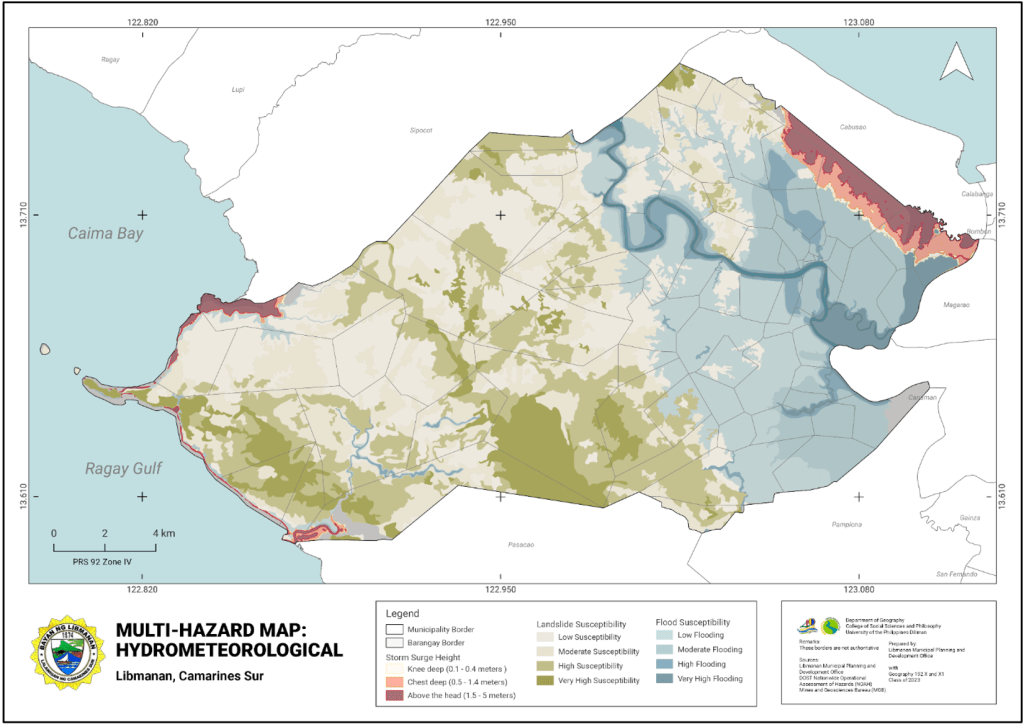
Map 2 – Hydrometeorological hazards in Libmanan, Camarines Sur, Libmanan Municipal Planning and Development Office with Geography 192 X1, Class 2023
The presence of the Legaspi Lineament Fault Line and the occurrence of past and recent earthquakes in Libmanan signify exposure to geological hazards. Notably, inland and underwater earthquakes of significant magnitude have been documented either within the municipality or in its proximity. On December 12, 1993, a magnitude 5.6 earthquake struck with its epicenter near the municipal center, where densely populated settlements are situated. A fault line map also reveals that the western section of the municipality is traversed by the Legaspi Lineament, intersecting the barangays of Bahao, Tinalmud Nuevo, and Tinalmud Viejo (Map 3). Areas within 5 meters on both the left and right sides of the fault face a high risk of ground rupture (USGS, 2023).
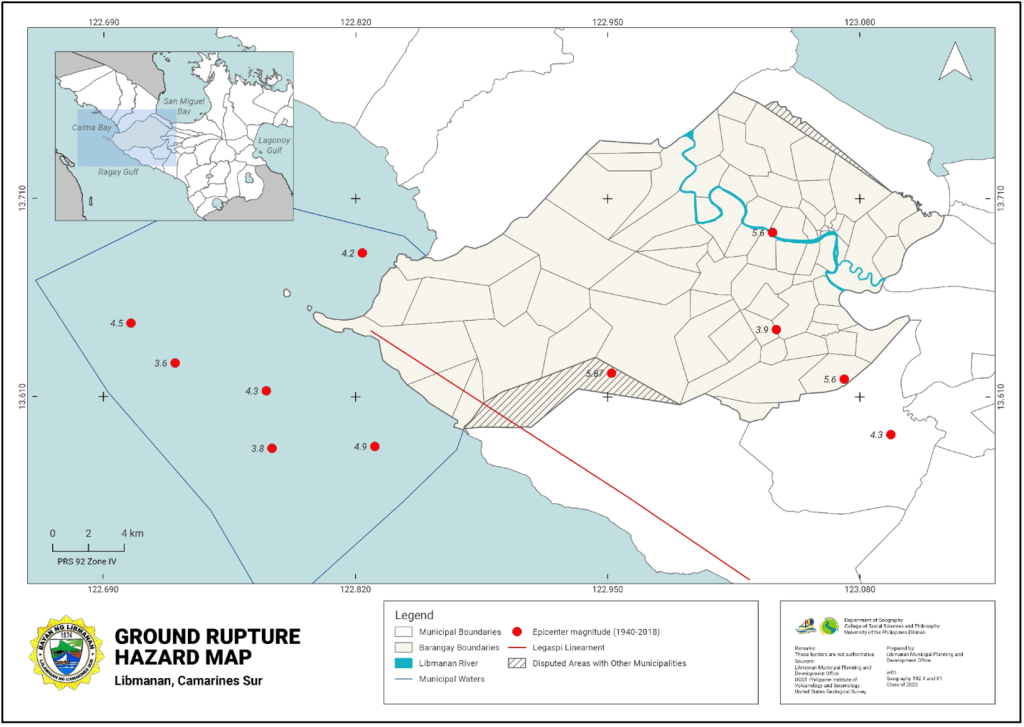
Map 3 – Significant earthquakes from 1940-2018 and fault line in Libmanan, Camarines Sur, Libmanan Municipal Planning and Development Office with Geography 192 X1, Class 2023
Disaster and exposure to hazards are a matter of time … and space!
Mapping exposure to hazard is a crucial aspect of spatial representation of disaster risk. This process involves illustrating the objects, relationships, phenomena, and elements that collectively define or constitute disaster risk on a map. GIS-based data formats and semiotics, such as vector and raster data depicted through points, lines, polygons, and various colors, visually convey indicators like hazards, vulnerabilities, and capacities.
The records of hazard events in the municipality of Libmanan indicate their frequent occurrence. Various hazards have affected and will continue to impact the municipality at least once or twice a year, potentially even more frequently. Disasters are a matter of time, especially for the most vulnerable people and communities. However, disasters are also a matter of space – they occur in specific locations or geographical areas that can be identified and mapped. It is important to continue the efforts to map and spatially represent hazards and disaster risk to inform the public, decision-makers, and duty bearers.
Students of Geography 192 Midyear 22-23, Emmanuel Garcia, Jake Rom Cadag
January 31, 2024
References
Municipal Disaster Risk Reduction and Management Office of Libmanan (2023). Compilation of Barangay DRRM Plans 2020-2022. Libmanan, Camarines Sur. Unpublished Document.
United States Geological Survey (2023). Significant Earthquakes Archive 1900-2023. Retrieved on August 21, 2023 from https://earthquake.usgs.gov/earthquakes/search/

Leave a comment