“Micro” Mapping of UP Diliman
In two undergraduate Geography 1 (Places and landscapes in a changing world) classes, micromapping the campus was instituted and assigned by Assistant Professor Fernand Francis Hermoso not only to assess the students’ highly subjective cartographic imagination of their campus, but also enable them to concretise in visual form various representations of this familiar place as gleaned from their unique experiences and encounters. The inspiration behind micromapping originally stemmed from Asst Prof Hermoso’s encounter with UP campus as his spatial environment when he was a first year undergraduate of UP Diliman in 2006. Back then, digital phones have yet to be handheld essentials of UP denizens. It started with a challenge to give directions to the (now nonexistent) Shopping Center, where he provided a rough sketch of a map on tissue paper to graphically represent the building. Drawing from the inspiration of psychogeographers of the 1960s who depict their lifeworlds on their own terms, often hand-drawn, the micromapping project in Geography 1 is premised on the notion that everyone can provide and be a source of direction – a fundamental concept in geography.
For the present micromapping activity, students are to create maps in an 10 x 15 cm paper. The choice of the paper’s size to create maps offer a challenge to students to capture micro-stories within UP Diliman and enriched by stories that may not be visible in the completed maps. Three submissions were randomly chosen to represent the two Geography 1 sections and offer very different views of the campus as site for resonant sensations and emotional entanglements. The maps below offer a glimpse of various map stories in the order of importance these mappings inspire in the life of an individual student. Permission was granted by students to spotlight their maps for this site. Their stories are excerpted and edited for clarity.
A. Geographies of Sleep

Map 1: Most Sleepable Places in UP Diliman, J R Ballesteros, 2024
Oftentimes seen as a sign of laziness, tiredness, exhaustion and daydreaming, or having a lie-in, sleep has been interpreted differently by society at large. According to human geographers Peter Kraftl and John Horton: “sleep is a fundamentally spatial, and spatially-productive phenomenon, and some understanding of sleep, sleeping and sleepiness … should afford new understandings of both the ‘human’ and ‘geography’ in human geography” (p. 510). Sleep, especially in the context of its deprivation, needs new studies to characterise the post-pandemic sleeping patterns of people.
A student drew a map of his subjective understanding of the ‘sleepable places’ in campus because as he reasons out: rest is important so that the mind is recharged for the upcoming challenges. This is especially true when requirement deadlines and examinations are looming. The places he identified in his map are his encounters and while these subjective readings may not be held by other students, these places were also vetted by his peers as regards spaces conducive to rest and sleep.
“As a student who spends most of the night at work rather than sleeping, I have a good idea on some locations and how comfortable they are to sleep in. I dedicated about 4 days to sleeping in other facilities to test their sleepability. Because of the many buildings and facilities around the campus, other buildings were based on interviews from students with questions such as, “How comfortable is it to sleep there”, “Do they have a place dedicated to lying down” and more.”
It is also interesting to note that proximity to the buildings of the student’s enrolled courses take precedence in the selection and choice of sleepable places.
“When I finished mapping, the main lesson I learned was how different facilities provide accommodations for students. An example is the College of Science Library having a platform dedicated to lying down and sleeping, while the Marine Science Institute’s library provides bean bags for the students to rest in. Each facility has its strengths and weaknesses in this regard and it was a good experience learning which building I preferred resting in.”
The maps are color coded according to the experience of sleeping comfortably. Rosemary Cooper who edited the book Sleep in 1994, said: “Human beings spend about one quarter to one third of their lives asleep, so that in a span of three score years and ten, sleep occupies 17 to 23 years” (p. xv). When one ponders the centrality of sleep in any person’s life in terms of the temporal dimension, one wonders why studies about sleep in relation to the full functioning of an individual are not covered frequently by human geographers.
B. The Mathematics of Where-ness

Map 2: MAPthematics, J R Dugtong, 2024
One’s aptitude and predilection for mathematics to an individual depends on a lot of factors: is it due to the immersive quantitative socialization at an early age? Is it due to personal aversion to mathematical symbols? Is genetics a significant factor? For this particular map however, the student is not concerned about aptitude in maths; instead he assiduously browsed publicly available online curricula of academic programs and reviewed those programs that require mathematics courses for their students. The map color coded the buildings where these academic programs are housed to show how maths figured prominently in programs. Engineering and science programs figure prominently in regard to the number of times students enrol in maths courses. Because of the UP-centric slant of this project, appreciation of this map is hinged on one’s knowledge of the buildings that housed these academic programs.
While this may be banal information for others, the student cartographer proceeded with this project as a homage to his former mathematics-based academic program and his own undying love for maths.
“I felt ecstatic the moment I finished the map. I never thought I’ll be doing that map about “mathematics” since I’m no longer included in that program. I was happy … because the program (Mathematics) lives in my heart.”
C. The Canine and Feline Distribution in Campus
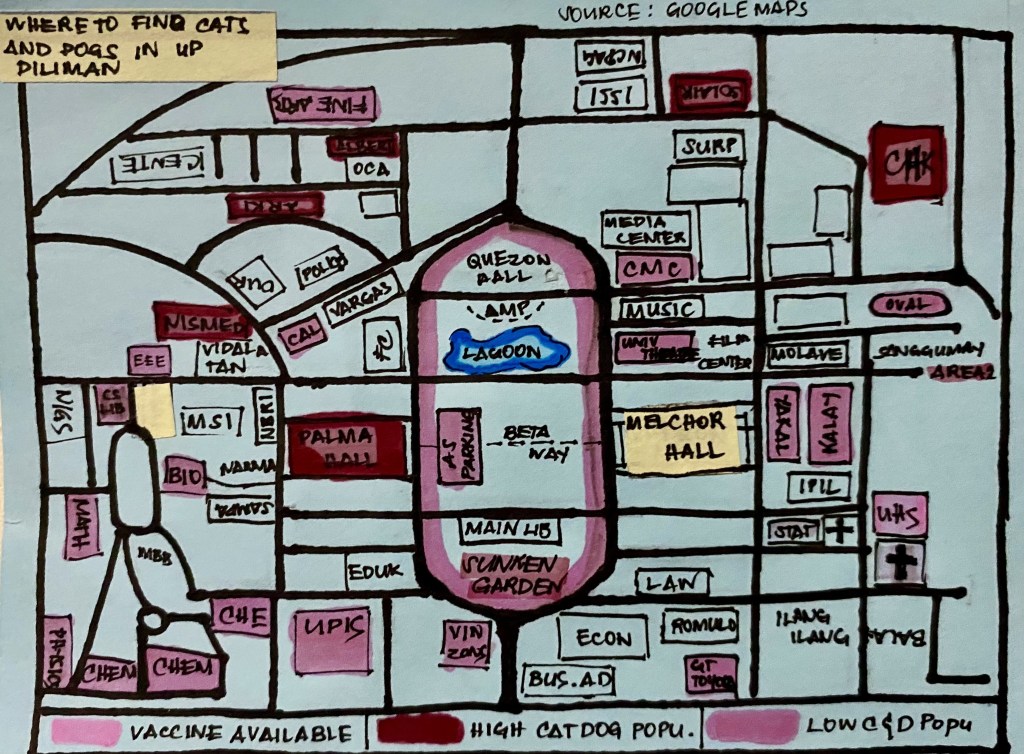
Map 3: Where to find cats and dogs in UP Dilliman, B C Garcia, 2024
Mapping the highly mobile population of cats and dogs in campus can seem like an impossible task given that these animals are not officially housed in particular buildings, but mapping can offer a snapshot of the current state of dogs and cats roaming inside campus.
The third map focuses on these peripatetic campus creatures but the student cartographer’s inspiration for the creation of this map was through a rather unpleasant encounter with a cat.
“I was scratched by one of our (then) fourteen cats at my dorm within UPD. This was the second time that I needed to get a shot for anti-rabies because of the cats. Funnily enough, I remembered that the first time I got a shot at the University Health Service, one of the nurses was joking about how they were going to run out of their supply of anti-rabies vaccines at the rate at which students were getting bitten or scratched by stray cats. I figured that my experience, alongside others who I know could help others to be careful when interacting with our furry friends on campus.”
The map is one of a few projects aimed at conducting a survey of cat and dog population in campus by visiting the buildings where these animals usually stay. An earlier study was conducted in June 2016 by a group of geographers — Christelle Bautista, Leslie Dolalas and Ryan Baje — who first mapped the pre-pandemic dog and cat population as part of their field geography class.
“I was happy to know that studying at UPD makes you appreciate the small things in life, such as cats. As the popular in-campus saying goes, “‘Di ka puwede sa UP kung ayaw mo sa mga pusa.” This rings true since the majority of the buildings are populated with cats. My favorite part of asking around was talking to the guards of each building that I frequented. More often than not, the guards were the ones taking care of the cats and dogs that live on campus. They pay out of pocket for the food, spaying, and medicine. I am personally close to our day shift guard at my dorm because five of the cats that they take care of recognize me. So, I’d say that most of my data come from my own experiences and the knowledge of others around the campus about our cats and dogs.”
The map shows where these animals are but as they are mobile, a margin of error should be considered when faced with the actual number of cats and dogs. However the findings of the present map closely resembles the earlier map of Baje, Bautista and Dolalas. We can infer that the 2024 population remain relatively similar to that in 2017. Further, the student notes that aside from cats and dogs, there are also chickens, goats and other animals on campus — both domesticated and wild. This can be seen that the campus is a haven for animals, although recent debates in the university pose the question whether animals particularly cats and dogs have a right to roam freely inside the campus premises or are they becoming a menace. If animals can speak like humans, they probably have a different opinion and may stress upon the anthropocentric nature of institutions and may demand for their rights to be in campus just like humans.
Maps tell tiny stories whether they are sleepable areas or cat and dog populations. While these maps’ specific focus tend to be niche and specific to UP denizens, micromapping enables people to make maps of their own to represent things that resonate broadly with them. Stories are valued as a significant component of geonarrative mapping as these complement the flatness of visual representations. This exercise is a snapshot of micro mapping multiple lives and sensibilities within the wide expanse of UP Dilliman campus.
Joseph Palis & Fernand Francis Hermoso
Acknowledgments:
Bianca Clareese Garcia, Jed Randolf Ballesteros, John Russelier Dugtong & Geography 1 THW & THX classes, 1st Semester 2024-2025.
References
Baje, R.N., Bautista C. & L.L. Dolalas (2016). Where are they and why are they there, unpublished Geography 192 field report. https://www.arcgis.com/apps/MapSeries/index.html?appid=0942163ddbc4451496d4a2bb77c6ebc7
Cooper, R. (1994) Preface. In Cooper, R. (ed), Sleep, London: Chapman and Hall Medical, i–xix.
Kraftl, P. & J. Horton (2008). Spaces of every-night life: for geographies of sleep, sleeping and sleepiness, Progress in Human Geography, 32(4), 509–524.

Leave a comment